
The Data Breach Perception Problem in 2022
Looking for the latest version?
Click the button!
It’s here! Our updated research looks at how data breaches happened, what academia published, what the news covered, and what people Googled.
The 2022 update to our research on the perception of data breach causes that’s helped organizations re-evaluate how they are at risk for a data breach instead of what feels right. So what’s new, what was our methodology, and what was surprising? Keep reading to find out more!
First, a little background
It’s been a little over a year since we first shared our research on the data breach perception problem. Since there’s another year’s worth of data, we’ll walk you through our methodology, our updates, and some surprising findings!
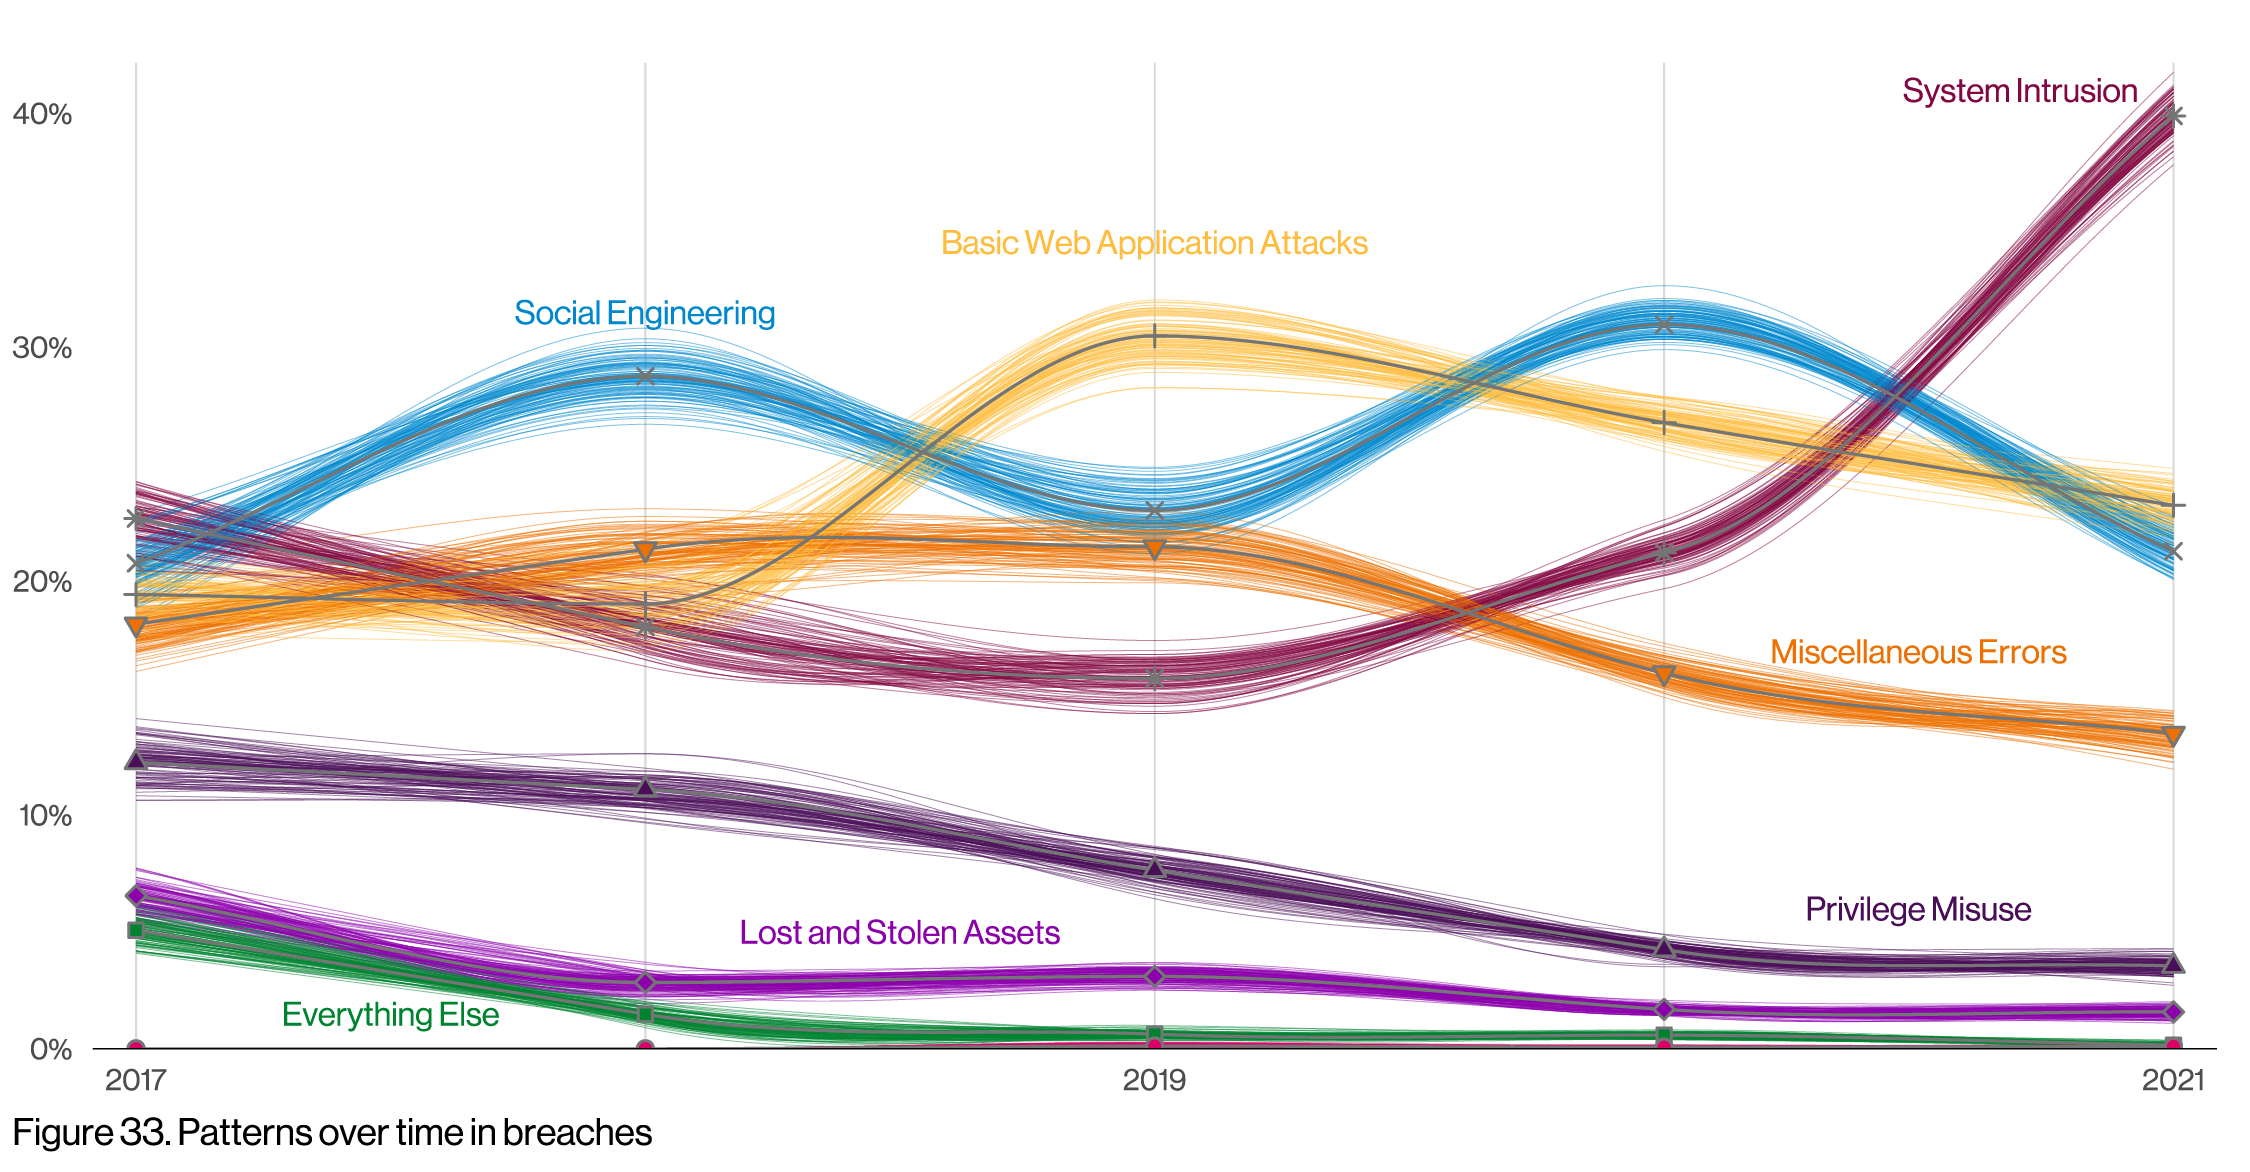
Verizon’s 2022 Data Breach Investigations Report (DBIR) [1], an industry publication that analyzes cybersecurity incident and breach event data from around the world, found that over 99% of all incident and breach events fall into one of eight major categories.
In their 2021 report, Social Engineering and Basic Web Application Attacks accounted for over 50% of all breach events. In their 2022 report, System Intrusion took the lead, accounting for 40% of all breach events.
Source: DBIR [1]
“So what do these categories mean?”
DBIR incident and breach classification patterns are based on clustering of data as opposed to how the cybersecurity industry tends to group them when we talk about data breaches and incidents. Here are some examples of the types of incidents and breaches that fall within each group:
System Intrusion: ransomware, malware, stolen credentials
Social Engineering: phishing emails, texts, phone calls
Basic Web Application Attacks: SQL Injection
Miscellaneous Errors: misconfigurations
Privilege Misuse: disgruntled employee data leak
Lost and Stolen Assets: stolen laptop or phone
Denial of Service: DDoS attacks
Everything Else: ATM card skimmers
The DBIR results were surprising to some of us. When we thought about the data last year, it felt like hackers and ransomware should have been at the top (these fall under System Intrusion). But that wasn’t what the DBIR data had shown. This time around, if you thought ransomware and phishing should have been at the top (these fall under System Intrusion and Social Engineering) you would have been right!
What influences our perception of cybersecurity breach causes? Do those perceptions reflect reality? If the news media and the internet are leading us astray, maybe we can pinpoint what those influences are and systematically reduce our bias on those topics.
One way to address the question of what we perceive as cybersecurity breach causes was inspired by Hannah Ritchie and Max Roser’s 2018 article comparing causes of death data to what the New York Times, The Guardian, and Google Trends covered as causes of death. We adapted their approach to investigate the perceptions of cybersecurity breach causes. We looked at five sources of data -- New York Times, The Guardian, Google Trends, Google Search, scite.ai -- to compare how frequently their cybersecurity breach coverage fell into each one of the DBIR’s classification patterns.
You may be asking “Why data from 2021 when it’s 2022?” To be honest, it takes a while for all of the research to be consolidated and released to generate this analysis. Since we rely on the publication of other works, like the DBIR, to complete our research, we are now able to release this report!
Analysis
Perceptions of Data Breach Causes
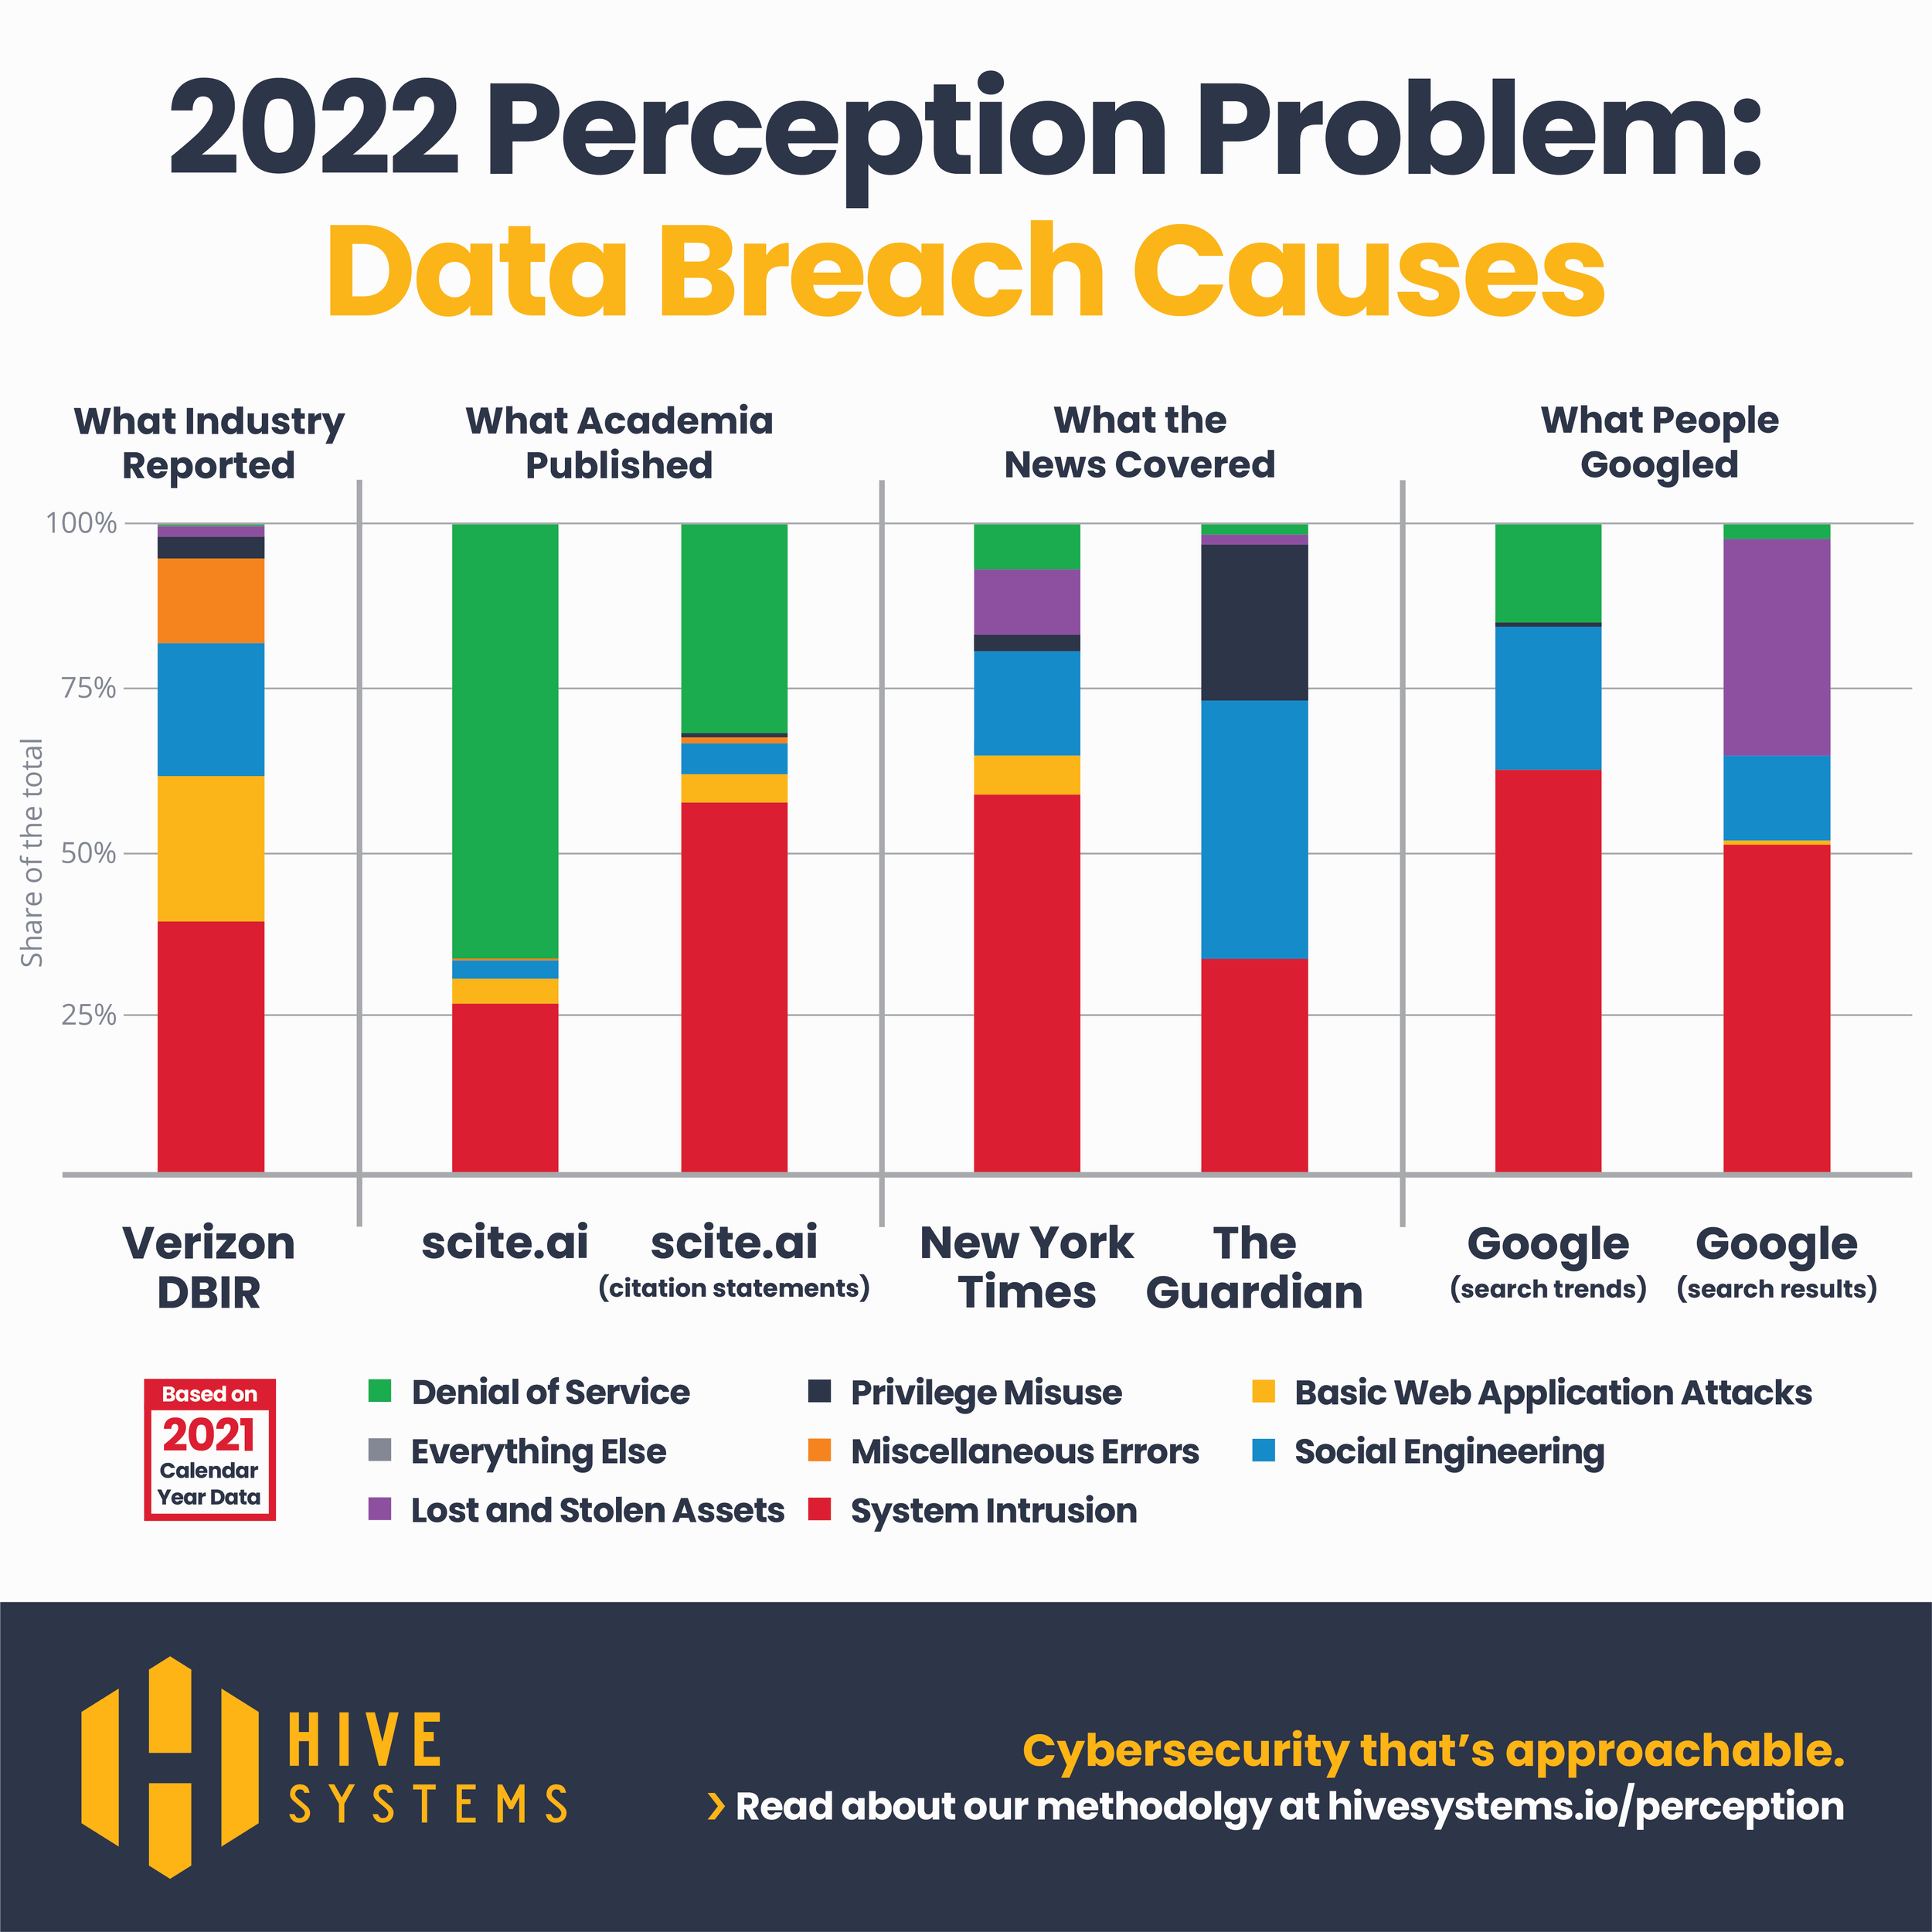
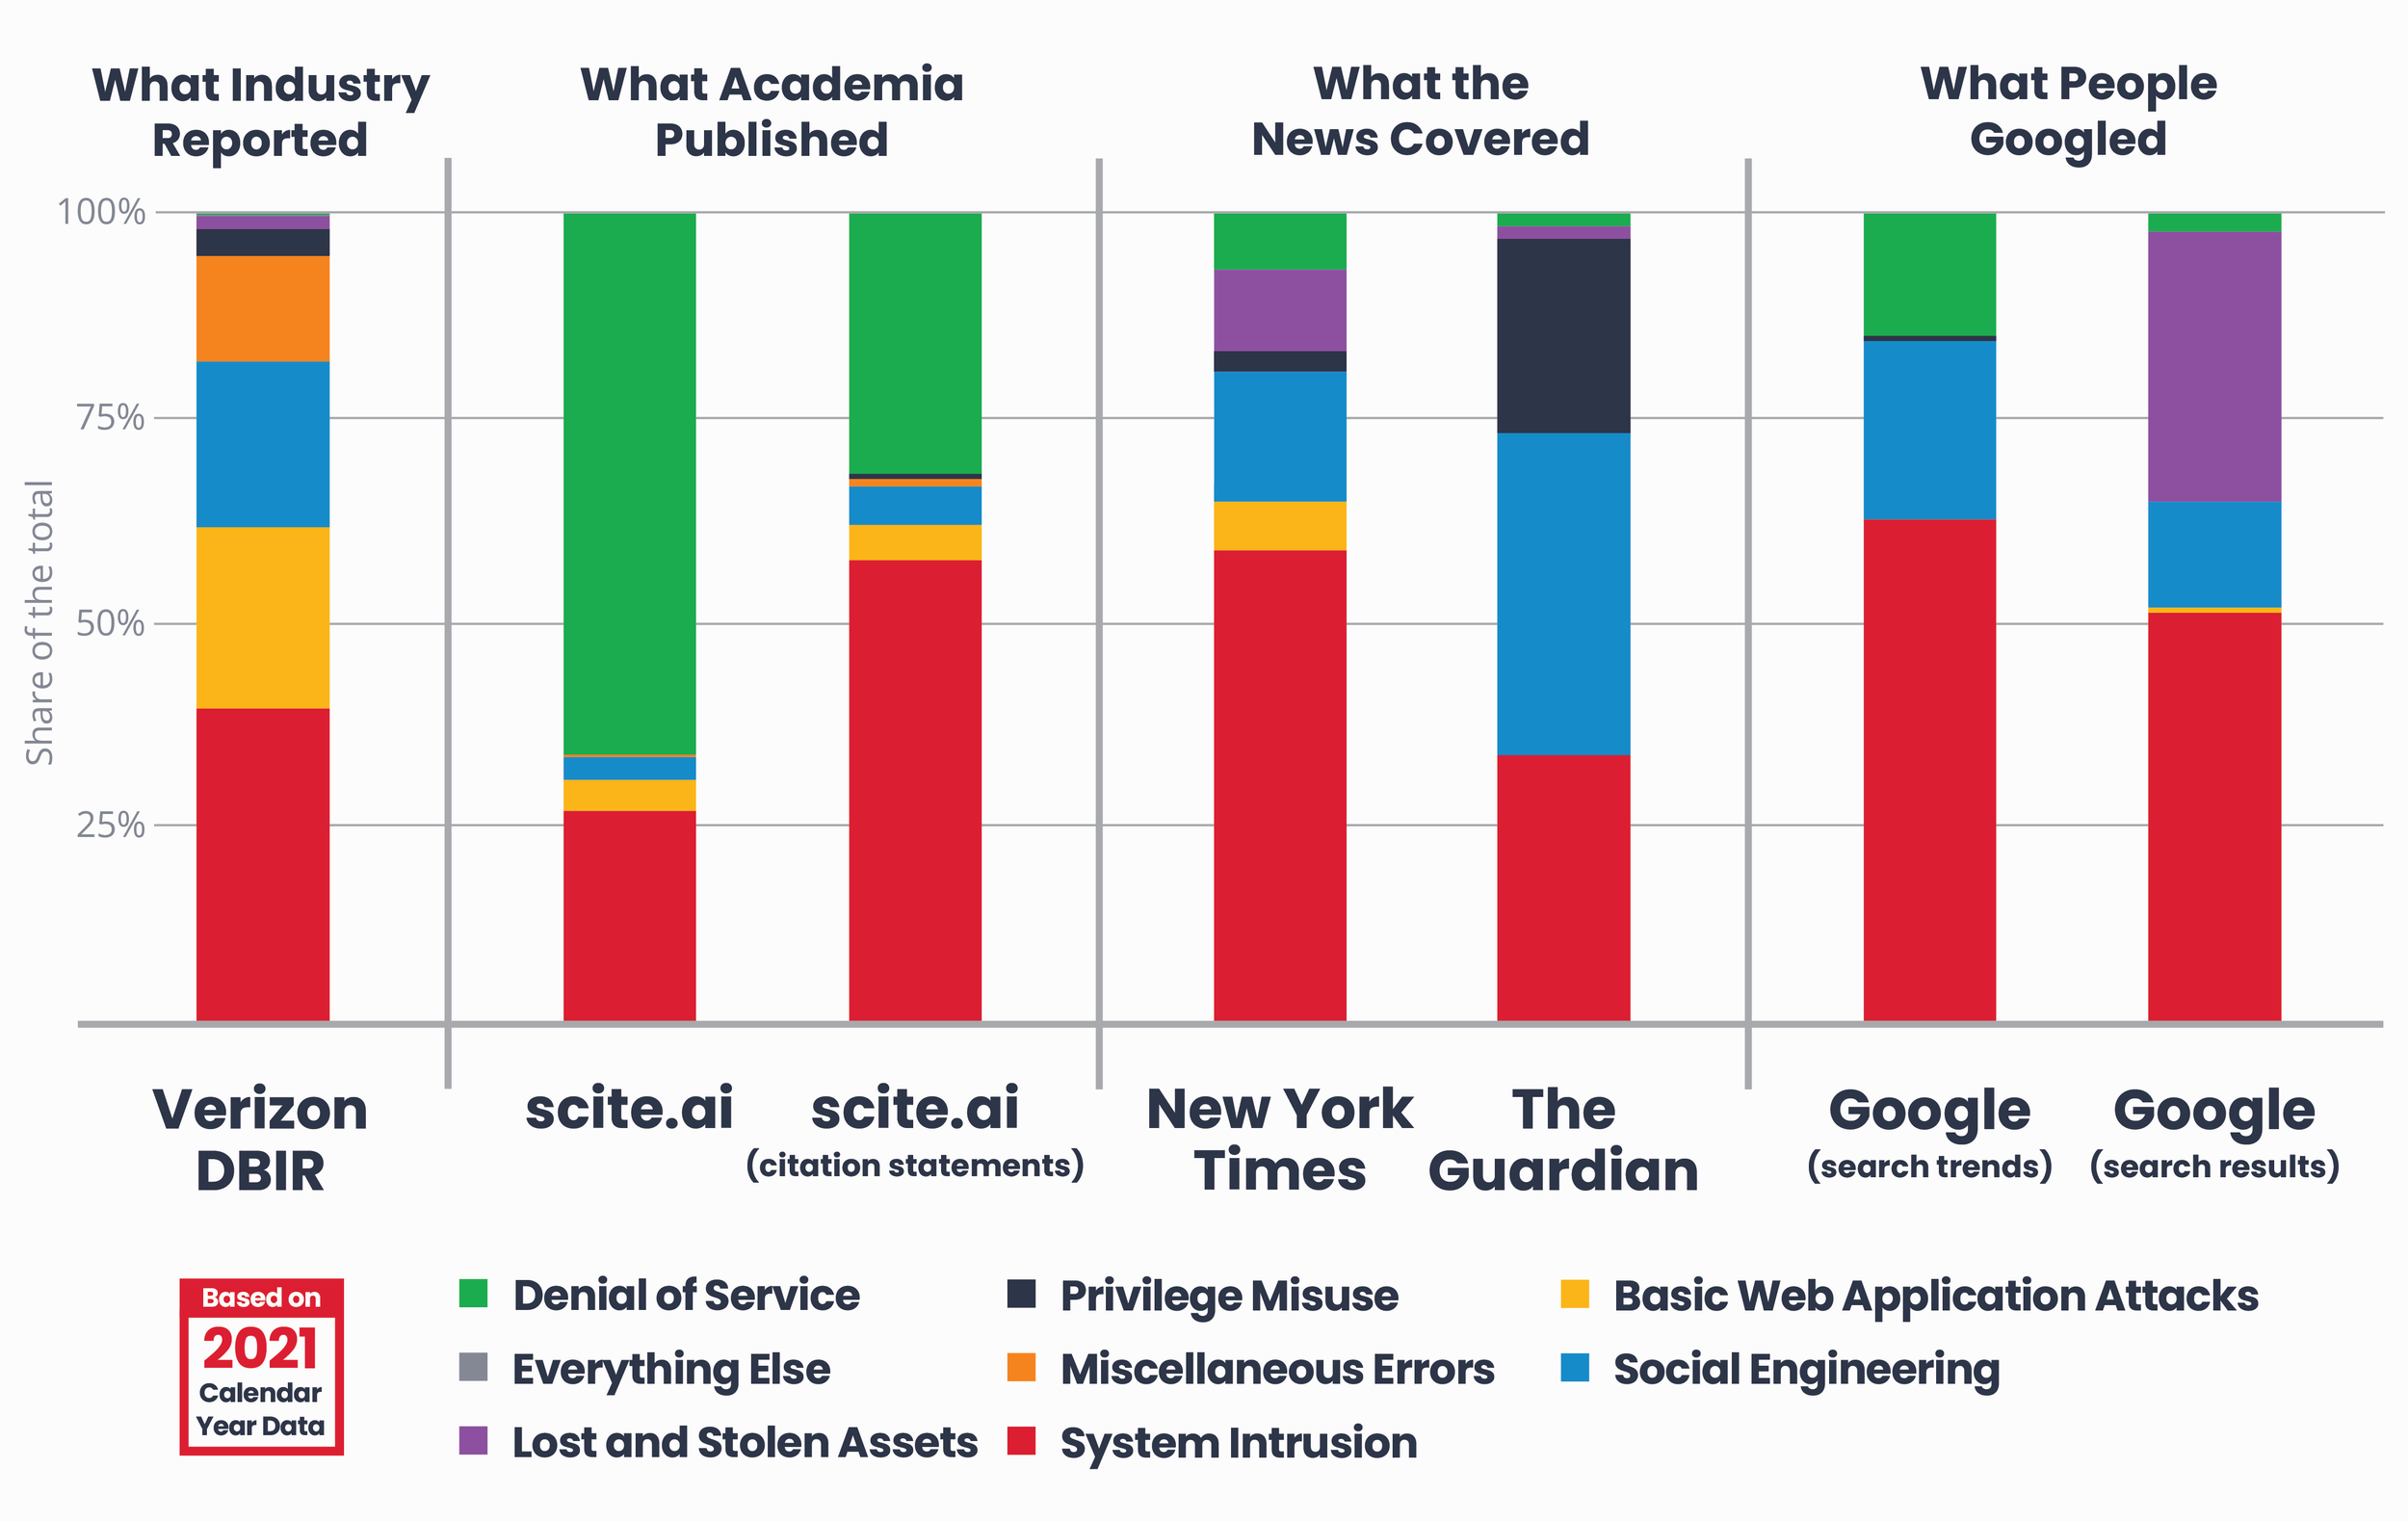
We were interested in comparing what the DBIR, Google, news outlets, and academia reported as the causes of data breaches like we did last year but for the new 2021 data. To that end, we refreshed our keywords and search terms related to cybersecurity incidents and breaches for each of the eight DBIR categories. We searched for those terms across Google Trends, Google Search, New York Times, The Guardian, and Scite.ai using each outlet’s search feature and Application Programming Interface (API), inspected the search results for semantic context (e.g. phish email, not Phish the band), and tallied the number of hits in each category by outlet. Since we were interested in relative shares, we normalized the remaining counts by dividing them by the total for the year. Here is what we found:
People create and engage with cybersecurity content for many reasons. Since our approach here was exploratory, we made the assumption that people tend to turn their attention and subsequently dedicate their resources to cybersecurity content that they feel will solve their most pressing cybersecurity problems (likely based on what they feel is the biggest risk). We also assume here that DBIR captures the “true” causes of breaches, as opposed to what people feel -- and would Google -- as the cause of breaches.
Here are some insights we can draw from our analysis:
What caused data breaches in 2021?
DBIR listed System Intrusion (that includes hackers and malware, including ransomware attacks, but not web application attacks) as the top cause of breaches in 2021 (it was Social Engineering in 2020), followed by Basic Web Application Attacks (same as 2020) and then Social Engineering. We used that as our baseline.
What did “the internet” think caused breaches in 2021?
Googlers once again seemed largely preoccupied with System Intrusion events (ransomware, malware, hackers) with Social Engineering growing from 12% to 22% of relative searches. Journalists seem to agree and published quite a large number of articles following that trend.
Google (search trends)
What did the news report as having caused breaches in 2021?
New York Times and The Guardian coverage mostly agreed with what people were searching for. NYT has a larger proportion of pieces covering Denial of Service attacks.
New York Times
The Guardian
What did academic research say about data breaches in 2021?
Academic publications aligned most closely with DBIR in terms of coverage proportion across topics in 2020 but not so much in 2021. Social Engineering was dwarfed by Denial of Service in the case of research papers, while System Intrusion was the focus of citation statements (which includes citing other research papers, including previous years’ papers). This functionality was not available during our research last year.
scite.ai
scite.ai (citation statements)
What content was available to us in 2021 if we did a Google search?
In 2020, nearly half of the Google-able internet’s share of these topics was content mentioning Lost and Stolen Assets, particularly smartphones. System Intrusion was the next most Google-able topic
In 2021, System Intrusion dominated and closely resembled the DBIR. Once again all other categories were shadowed by System Intrusion, Lost and Stolen assets, and Social Engineering.
Google (search results)
Did popular Google searches align with DBIR breach causes or did they miss the mark?
In 2021, like in 2020, what we Googled was System Intrusion, Social Engineering, and Denial of Service information. But, as described above, in terms of actual search results, what we got was a lot of “How to locate your stolen iPhone” and other lost/stolen device content.
DBIR
Google (search trends)
Methodology
To perform the searches, we compiled a list of keywords and search terms (like “phishing” or “social engineering”) for each of the eight DBIR cybersecurity incident and breach cause groups. We collected the initial keywords and terms from the 2021 DBIR report, the National Institute of Standards and Technology (NIST) Glossary of Key Information Security Terms [3], and from the cybersecurity professionals at Hive Systems. We entered the lists into Google Trends and added the resulting related queries suggested by Google to the respective lists. We repeated the process until the Google Trends related query results were no longer related to the respective DBIR cause groups. This was particularly helpful because it ensured we included terms the names given to ransomware strains in our searches for “ransomware,” which are the terms people actually use in their search queries.
Counting Google Trends Results
We first entered the keywords and terms into Google Trends, but ended up getting more relevant results by using Google Trends’ Topics feature. We went with Topics because the feature includes synonyms as well as multiple languages. We also tested using all combinations of Google Trends Topics and Google Categories in order to find which combination of Google Trends settings yielded the most accurate results and the largest number of results. Trends Topics are useful because they include concepts based on your keywords e.g. if you use the topic “London” Google silently includes results for searches of "Capital of the UK" and the words for London in other languages. Trends Categories are also useful because they narrow down concepts to your subject of interest e.g. searching for the term “jaguar” yields results for the animal and car manufacturer of the same name unless you specify one or the other category. What yielded the most results and the fewest errors was using the category "Computers & Electronics" and the trends topics "Web application security,” “phishing,” “security hacker,” “insider threat,” and “denial-of-service attack."
Counting Google Search Results
We sampled Google search results for relevance by reviewing the last pages in each result set -- pages that Google finds least relevant. We counted results only on pages with results that were related to the topic being queried. We based relevance on the Google preview of the content.
Counting New York Times and The Guardian Results
We used the New York Times and The Guardian API to see how many articles in 2021 contained each keyword and search term. Starting with the search terms that yielded the highest number of results, we manually reviewed headlines for their relevance to each topic. If the article was not on topic, it was not counted. We reviewed each individual result for relevance with the exception of results for System Intrusion due to volume. Instead, we randomly sampled System Intrusion results until at least 10% of the total were reviewed.
Normalizing the Counts
Since we were interested in relative shares of cybersecurity incident and breach causes by cause group, we normalized each data source's values by dividing the number of reports in each category by the sum of all reports for the year 2021.
Caveats and Limitations
Our results are based on a convenience sample and we cannot claim that our findings are representative or generalizable.
We did our best to put together an extensive list of incident and breach cause synonyms, including colloquialisms, but don’t claim to have used an exhaustive list.
None of the data sources we used provide raw output (even with their APIs), so the algorithms and biases of the search engines and sources will have influenced these findings.
Google Trends allowed us to pool results from multiple languages, but other sources presumably did not. Google Trends results may be skewed toward results in languages that happen to talk more about one of the topics.
We evaluated Google Search results using the Google summary blurb, but it is possible the blurbs were misleading and that reviewing the whole article is necessary. We were unable to do so due to volume, but could use sampling in the future.
Cybersecurity professionals and people under cyber attack may be more discrete in their searches and opt for search engines like DuckDuckGo instead of Google.
The search engines and news sites we chose are obviously not the only options. We chose them for their convenience (how many search engines have something like Google Trends?) and because of their prominence, coverage, and familiarity to our readers.
If you find a good informative result or article for your search, do you keep Googling it? Any topics people found quickly, they presumably searched for less. This means that good writers are throwing off our stats!
What do you think? Tell us!
Join the discussion below and keep us honest.
If there’s enough interest, we may add more stacks to the graphic like Wikipedia, Reddit, LinkedIn, Google patent search, security conferences, WayBack Machine, or other search engines.
References
[1] Widup, Suzanne & Pinto, Alex & Hylender, Dave & Bassett, Gabriel & Langlois, Philippe. (2022). 2022 Data Breach Investigations Report. Retrieved from: ‘https://verizon.com/dbir’.
[2] Widup, Suzanne & Pinto, Alex & Hylender, David & Bassett, Gabriel & Langlois, Philippe. (2021). 2021 Verizon Data Breach Investigations Report. Retrieved from: ‘https://verizon.com/dbir’.
[3] Hannah Ritchie and Max Roser. (2018) "Causes of Death". Published online at OurWorldInData.org. Retrieved from: 'https://ourworldindata.org/causes-of-death'.
[4] National Institute of Standards and Technology (2019) Glossary of Key Information Security Terms. Retrieved from: ‘https://csrc.nist.gov/glossary’.
Follow us - stay ahead.
Read more of the ACT


It's the 2024 update to our Hive Systems Password Table - including using a new “most-hacked” password hash. See why our Password Table has been shown and written about on the news, published by universities, and shared by companies across the globe. Learn more and download your copy!